Analytics is available in our Plus plan.
Mintt Instafeed Analytics shows how shoppers interact with your feed: views, clicks, and (optionally) influenced orders and revenue.
Step 1 - Open Analytics
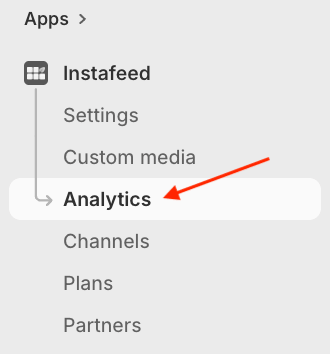
- Go to Shopify > Apps > Instafeed.
- Click Analytics in the left-hand menu.
Step 2 - Enable Analytics
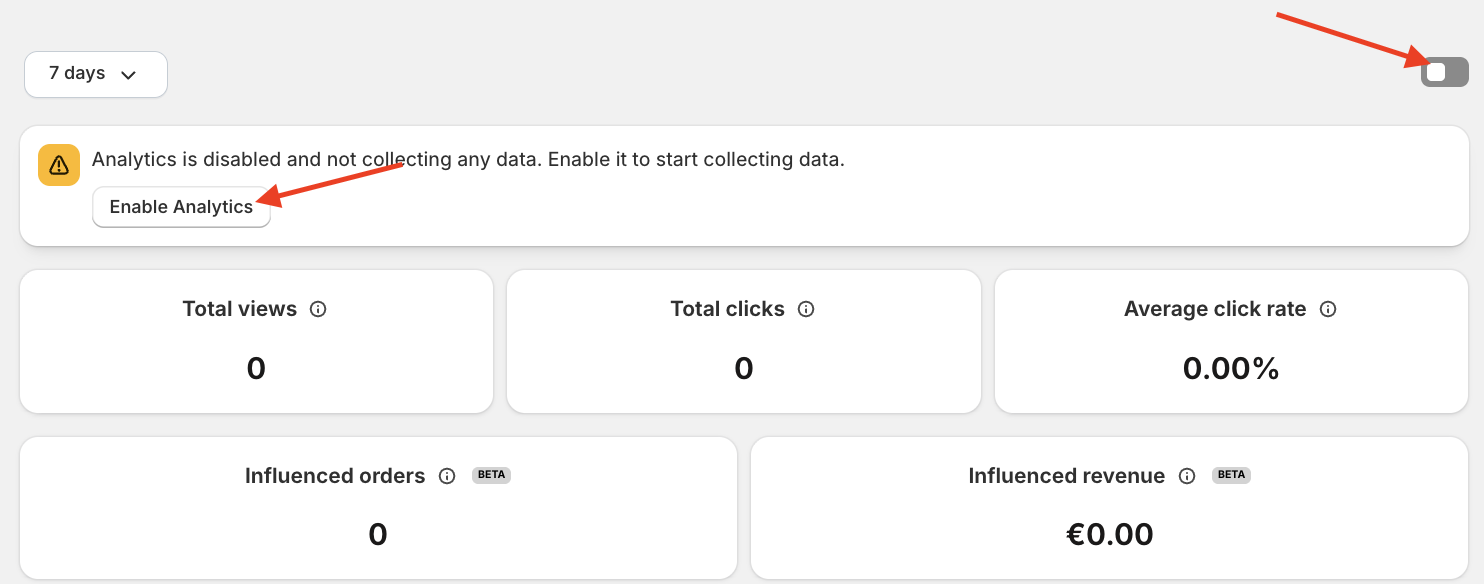
- Click the toggle in the top-right corner, or click Enable Analytics.
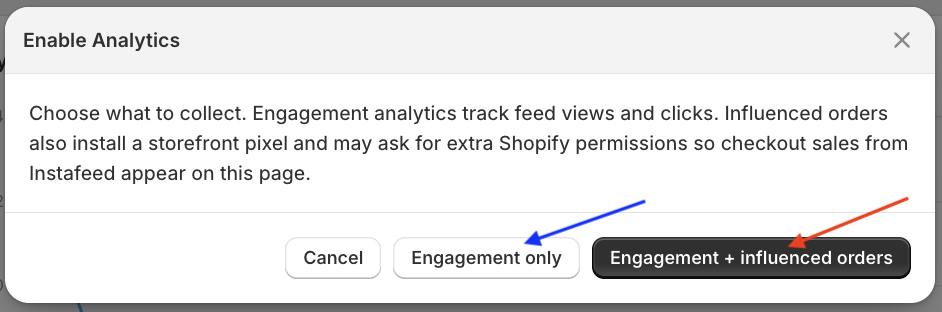
- Choose what to collect:
- Engagement only: feed views and clicks.
- Engagement + influenced orders: also tracks influenced orders and revenue. Installs a storefront pixel and may ask for extra Shopify permissions.
Engagement metrics
These metrics are available with either option.
- Total views: times a customer actually saw your feed on the storefront. A view only counts once the feed scrolls into view.
- Total clicks: post opens and product clicks from your feed.
- Average click rate: share of feed views that led to a post open or product click.
- Engagement and Influenced orders: two graphs for the selected period. The left chart (Engagement) shows views, clicks, and product clicks; the right chart (Influenced orders) shows orders and revenue when influenced orders are enabled. Hover over a point to see the exact numbers for that day. Turn on Compare to previous period next to the date range to overlay the matching days from the previous range on both charts.
- Top products: products with the most clicks in the selected period. Only shows if you have tagged products in your posts. Shown beside Top posts.
- Top posts: posts with the most clicks in the selected period. Shown beside Top products.
Influenced orders and revenue
These metrics are only available if you chose Engagement + influenced orders.
- Influenced orders: number of orders from shoppers who opened a post, viewed a product, or added to cart from the feed during the same visit. Also plotted day by day on the influenced chart.
- Influenced revenue: revenue from orders placed after a shopper opened a post, viewed a product, or added to cart from the feed during the same visit. Also plotted day by day on the influenced chart.
How to filter your analytics
You can narrow down the data shown on the page using the two dropdowns at the top:
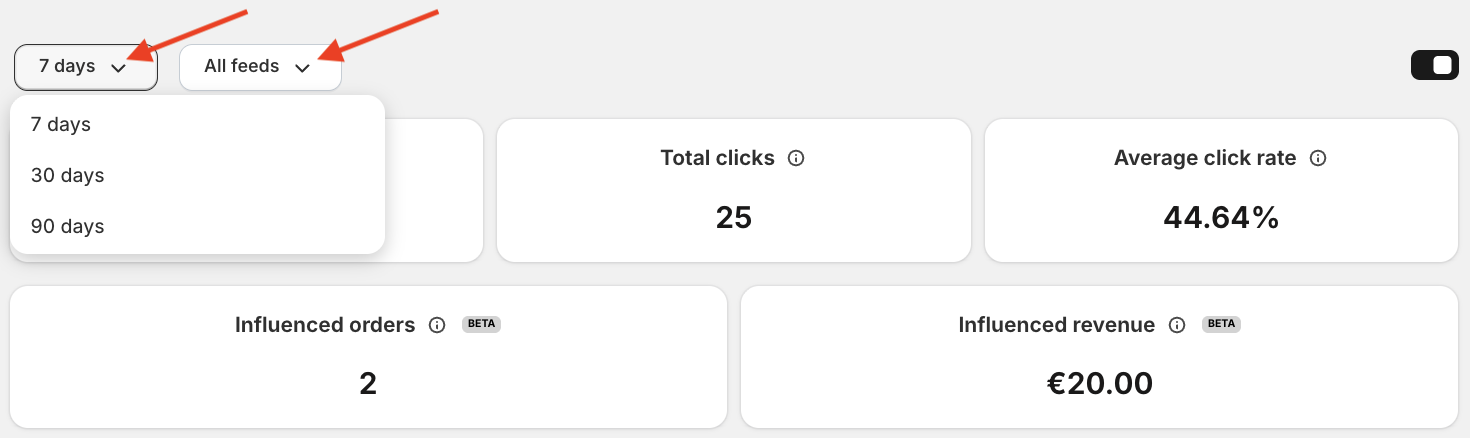
- Date range: choose 7 days, 30 days, or 90 days (30 days is the default).
- Feed: choose All feeds to see combined data, or select a specific feed to see its analytics on their own.
Common questions
- Why don't I see any data on the Analytics page?
Analytics is disabled by default. Go to Instafeed > Analytics and click Enable Analytics. Data collection only starts from the moment you enable it.
- What's the difference between Engagement only and Engagement + influenced orders?
Engagement only tracks views and clicks. Engagement + influenced orders also tracks influenced orders and revenue, and installs a storefront pixel.
- Can I switch from Engagement only to Engagement + influenced orders later?
Yes. Click the Enable influenced orders button on the Analytics banner to start tracking influenced orders and revenue.
- Why don't I see any Top products?
Top products only shows if you have products tagged in your posts.
- What counts as an influenced order?
Any order from a visit where the shopper interacted with your feed (clicked a post, viewed a product, or added to cart from it), even if they didn't buy directly from the feed.
- Can I see analytics for just one feed?
Yes. Use the All feeds dropdown at the top of the page to filter by a specific feed instead of viewing combined data.